Harnessing AI To Build Lightning-Fast Customer Insights in Natural Language
Last Updated on October 7, 2025
by White Widget AI and Data Science Team

White Widget Team
Need tailored software that moves your needle?
It's 2024, and we're still twiddling with dashboards. Where are my actionable insights?
For over a decade now, White Widget has launched dozens of successful e-commerce applications on frameworks like Prestashop, Shopify, Magento, etc. and from scratch. What's stayed true after all of this time, is that businesses will always need simple, smart insights. They want their teams to act fast and cut through the noise, without stumbling over complex data or missing crucial details. Most e-commerce solutions allow teams to monitor various metrics, but it takes effort to turn numbers and dashboards into an intuitive understanding. Business owners often ask themselves these key questions:
- How do I make my data boost sales?
- Which metrics truly matter?
- How can I simplify data for my team?
- Must we always lean on analysts?
- How do we swiftly spot and act on buyer trends?
- Why the struggle to tie metrics to customer joy?
Sophisticated tools can be powerful in the hands of domain experts, but the need for additional training raises the barrier before a team can adopt the measures in the first place, and this adds unneeded friction. You can certainly spend time poring over your data, but as a business juggling multiple concerns, your time and attention is limited. Enter AI. It can translate metrics into shop talk, instantly. Your team gets what it needs to move and improve, right away. And if you're like most businesses, you've collected much more data in the past than you've been able to turn into actionable insights. In this article, our AI and Data Science team will show you some key ideas on how you can make natural language insights work for you.
Structured Data to Natural Language with Generative AI
Generative AI presents a way to transform metrics into terms that can be intuitively understood without consulting technical documentation. Data coming in tabular or otherwise structured format can be processed with Generative AI into flowing sentences that make the numbers meaningful in context.
For each row in this dataset, write a short profile that puts together all available metrics in natural language.
We can provide the domain and specify the intended audience to further tailor our output, and even give it examples of the language and vocabulary we want.
This is data taken from a CRM Platform. Use plain language to communicate in simple, approachable terms. Ex: "Joe actively recommends our services, and is highly valuable to us over the long term based on the average and total values of his orders."
Table
Customer Metrics
| Customer | NPS (0-10) | AOV (USD) | CLV (USD) | Natural Language Profile |
|---|---|---|---|---|
| John Doe | 9 | 120 | 4,000 | John is a promoter with a Net Promoter Score of 9, indicating a high likelihood of recommending our services. His Average Order Value of $120 coupled with a Customer Lifetime Value of $4000 suggest he makes substantial purchases and is highly valuable over the long term to our company. |
| Jane Smith | 7 | 30 | 2,000 | Jane falls into the category of a satisfied customer with a Net Promoter Score of 7, showing she's content with our services, though not as enthusiastic in promoting us as others might be. Her lower Average Order Value of $30 and Customer Lifetime Value of $2000 suggest small but consistent transactions. Engaging Jane with personalized recommendations could potentially increase her transaction value and further her loyalty. |
| Alex Johnson | 3 | 75 | 2,500 | Alex is a detractor with an Net Promoter Score of 3, hinting at potential areas for service improvement. An AOV of $75 and a CLV of $2500 suggest higher than average spending, highlighting an opportunity to convert dissatisfaction into loyalty. |
Generative AI Is Not Enough
This is great, but there are some issues we need to keep in mind when using Large Language Models:
- LLMs have a tendency to express details that aren't present in the data we gave it in the first place. In February 2024, a court ruled that Air Canada had to refund a customer and pay tribunal costs after their customer service chatbot gave an erroneous answer regarding their company’s discount policy.
- It can inject stylistic flourishes that aren't aligned with facts or even simply the voice you have in mind.
- It might simply regurgitate the wording you used in your examples.
- LLMs are subject to the biases of their training data, so it can output stereotypical language that reduces their subject to their gender, ethnicity, or profession.
- Cost: LLMs are typically charged according to input and output volume, so generating a new profile each time you view the metrics will add up.
Alex's profile presents a unique challenge; while their Customer Lifetime Value of $2500 and Average Order Value of $75 indicate a good level of spending, a Net Promoter Score of 4 suggests dissatisfaction or indifference.
This discrepancy points to areas where our products or services may not meet Alex's expectations. Addressing their concerns and improving their customer experience is crucial for transforming Alex into a satisfied and loyal customer.
Frankie's pretty happy with us and is one of our regulars, making 20 purchases. He liked our latest campaign as well. Keeping him engaged is key, as he seems to like what he sees.
While these can be mitigated by modifying the prompt, it ultimately comes down to probability; this may not be acceptable if you do it at a scale where it will be difficult to spot unwanted material that slips through, especially in domains where wording can have legal implications. For all of these reasons, it’s simply not enough to give AI the freedom to generate text and call it a day. We can mitigate risks involving humans in the loop, and avoid unnecessary costs by promoting reusability. How do we do this?
Creating Templates for Reliable Scaling
One way to achieve this is to take all of the metrics important to us and create natural language explanations for ranges that fit our case. We involve domain experts (called human-in-the-loop or HITL) at the very start to ensure the fit of these explanations; once these are approved, however, we continue to benefit from their review as these templates are reused and extended to all of the platform’s users, with zero risk of hallucination typically associated with LLMs.
Table
Templates for Customer Metric
| Metric | Threshold Value Min | Threshold Value Max | Natural Language Explanation |
|---|---|---|---|
| Net Promoter Score (NPS) | 0 | 6 | This customer has given us a Net Promoter Score of {{value}}, placing them in the detractor category. They are currently less likely to recommend our services/products to others, suggesting there may be areas of our service that need improvement. |
| Net Promoter Score (NPS) | 7 | 8 | With a Net Promoter Score of {{value}} from this customer, they fall into the passive category. They're somewhat satisfied but not enthusiastic enough about our services/products to promote them actively. |
| Net Promoter Score (NPS) | 9 | 10 | This customer is a promoter, giving us a Net Promoter Score of {{value}}. They are highly likely to recommend our services/products to others, indicating a strong satisfaction and loyalty to our brand. |
| Average Order Value (AOV) | 0 | 50 | The Average Order Value from this customer is {{value}}, indicating they typically make smaller purchases. Tailoring product recommendations or offering bundled deals might encourage higher-value orders. |
| Average Order Value (AOV) | 51 | 100 | This customer's Average Order Value stands at {{value}}, showing a moderate spending level. Understanding their preferences can help us identify opportunities to upsell or cross-sell, enhancing their value further. |
| Average Order Value (AOV) | 101 | null | With an Average Order Value of {{value}}, this customer is among our highest spenders. Offering personalized services and exclusive deals can foster an even stronger relationship and maintain their high engagement level. |
Using AI-generated templates, we can cover ground that would otherwise be time-consuming for an expert to exhaustively document.
Table
Templates for Service Metrics
| Metric | Threshold Value Min | Threshold Value Max | Natural Language Explanation |
|---|---|---|---|
| Customer Churn | 0 | 5 | Our customer base is showing remarkable loyalty, with only a small fraction, specifically {{value}}%, choosing to leave us over the specified period. This indicates strong customer satisfaction and a solid foundation for growth. |
| Customer Churn | 5 | 15 | We're experiencing a moderate churn rate of {{value}}%, signaling a need to reevaluate our customer engagement and retention strategies. Identifying the primary factors contributing to customer departure will be crucial in reversing this trend. |
| Customer Churn | 15 | 100 | A churn rate of {{value}}% points to significant challenges in retaining our customers. Immediate action is necessary to address the underlying issues causing dissatisfaction. Engaging directly with customers to understand their concerns will be key steps towards reduction. |
| Customer Effort Score (CES) | 1 | 2 | With a Customer Effort Score of {{value}}, our customers find it very easy to use our services. This excellent score suggests that our efforts to streamline customer experiences are paying off, leading to higher satisfaction and loyalty. |
| Customer Effort Score (CES) | 2 | 5 | Our Customer Effort Score stands at {{value}}, indicating a moderate level of effort required from our customers to use our services. There is room for improvement to make interactions more seamless. |
| Customer Effort Score (CES) | 5 | 7 | A Customer Effort Score of {{value}} suggests that our customers are finding it difficult to use our services. This is a critical area for improvement, as reducing the effort required can significantly enhance customer satisfaction and loyalty. |
Expanded Applications
We’ve gone over a simplified and generic case to demonstrate how we can build a reusable template library for Natural Language Generation that mitigates risks and costs associated with generative AI, keeping humans in the loop to ensure accuracy and validity. This is just the start of what we can do.
We can add more variety and tailor our text by highlighting features present in the data. For example, we can watch for noteworthy combinations of metrics that correspond to user segments or suggest quick wins.
Jane Doe has a high Customer Lifetime Value but low Recent Engagement. We can reach out with personalized recommendations to re-engage, or ask for feedback to address recent issues.
Moving beyond Large Language Models, we can enhance this understanding with other technology like ontologies and knowledge graphs, which can be used to flexibly but consistently classify the kinds of products that a customer engages with. AI isn't as reliable as we'd all like it to be, but adding in these kinds of specialised vector databases and knowledge stores make it truly incredible to work with. What we've found is no e-commerce business is the same. You have your secret sauce and you know your customers and products better than anyone, and that's what's made you successful. The next step is transforming keen insight into a shared team superpower, and that custom implementation should be created only for your business to use, which is where we could potentially help. There’s a lot that can be explored towards making complex data easier to grasp, and these are just a few examples of how we can harness AI to scale while keeping reliability and accuracy.
Table
CRM to NLG
| CRM Metric | Definition of Metric | Sample Value | Natural Language Explanation of Sample Value |
|---|---|---|---|
| Customer Lifetime Value (CLV) | The total revenue a business can reasonably expect from a single customer account throughout the business relationship. | USD 5,000 | "Over the course of our relationship, we expect to earn USD 5,000 from this customer, marking them as highly valuable to our company." |
| Net Promoter Score (NPS) | A measure of customer loyalty, calculated based on responses to a single question: How likely is it that you would recommend our company/product/service to a friend or colleague? | 75 (out of 100) | "This customer is highly likely to recommend us to others, with a score of 75 out of 100, showcasing a strong advocate for our brand." |
| Churn Rate | The percentage of customers who stop doing business with a company over a given period. | 20% | "20% of our customers have stopped using our services within the specified timeframe, indicating a need to enhance customer satisfaction and retention strategies." |
| Conversion Rate | The percentage of visitors who take a desired action (e.g., making a purchase, signing up for a newsletter). | 5% | "Out of all the visitors to our site, 5% end up taking a desired action like making a purchase, highlighting the effectiveness of our call-to-action strategies." |
| Engagement Rate | A metric that measures the level of engagement that a piece of created content receives from an audience. | 85th percentile | "This customer engages with our content more than 85% of our audience, placing them in the top 15% for engagement. They are highly active and involved with our brand." |
| Average Order Value (AOV) | The average amount of money each customer spends per transaction with your company. | USD 45 | "On average, customers spend USD 45 per purchase, which helps us understand spending habits and tailor our marketing efforts accordingly." |
| Customer Acquisition Cost (CAC) | The cost associated in convincing a customer to buy a product/service, calculated by dividing the total costs associated with acquisition by the number of new customers. | USD 100 | "It costs us USD 100 on average to acquire a new customer, which is vital for evaluating the effectiveness of our marketing strategies and ensuring sustainable growth." |
| Lead Conversion Time | The average amount of time it takes for a lead to become a customer. | 30 days | "It typically takes about 30 days for a lead to convert into a paying customer, indicating the efficiency of our sales cycle and the effectiveness of our nurturing strategies." |
About the Authors
White Widget AI and Data Science Team excels in leveraging technologies such as machine learning, natural language processing, and generative AI, developing innovative solutions for the publishing, media, and entertainment industries—from crafting AI-driven games to enhancing public discourse and strategic decision-making through robust data analytics.
Primary Author
Albert D. a data engineer who excels in AI-driven data analysis, system optimization, and meticulous adherence to best practices. He particularly excels in semantic engineering, transport and geospatial data analysis.
Contributors
Jermaine P. a data engineer who focuses on emerging developments in AI and machine learning. A researcher and university educator, he's co-authored multiple papers on the subject, with special attention to NLP, semantic networks, and enhancing AI models using various techniques.
Andrea L. brings over two decades of expertise in software engineering, product design, and cybersecurity to her role as Chief Technical Officer at White Widget.

Case Study•
State-of-the-art ride hailing platform — relied on by millions
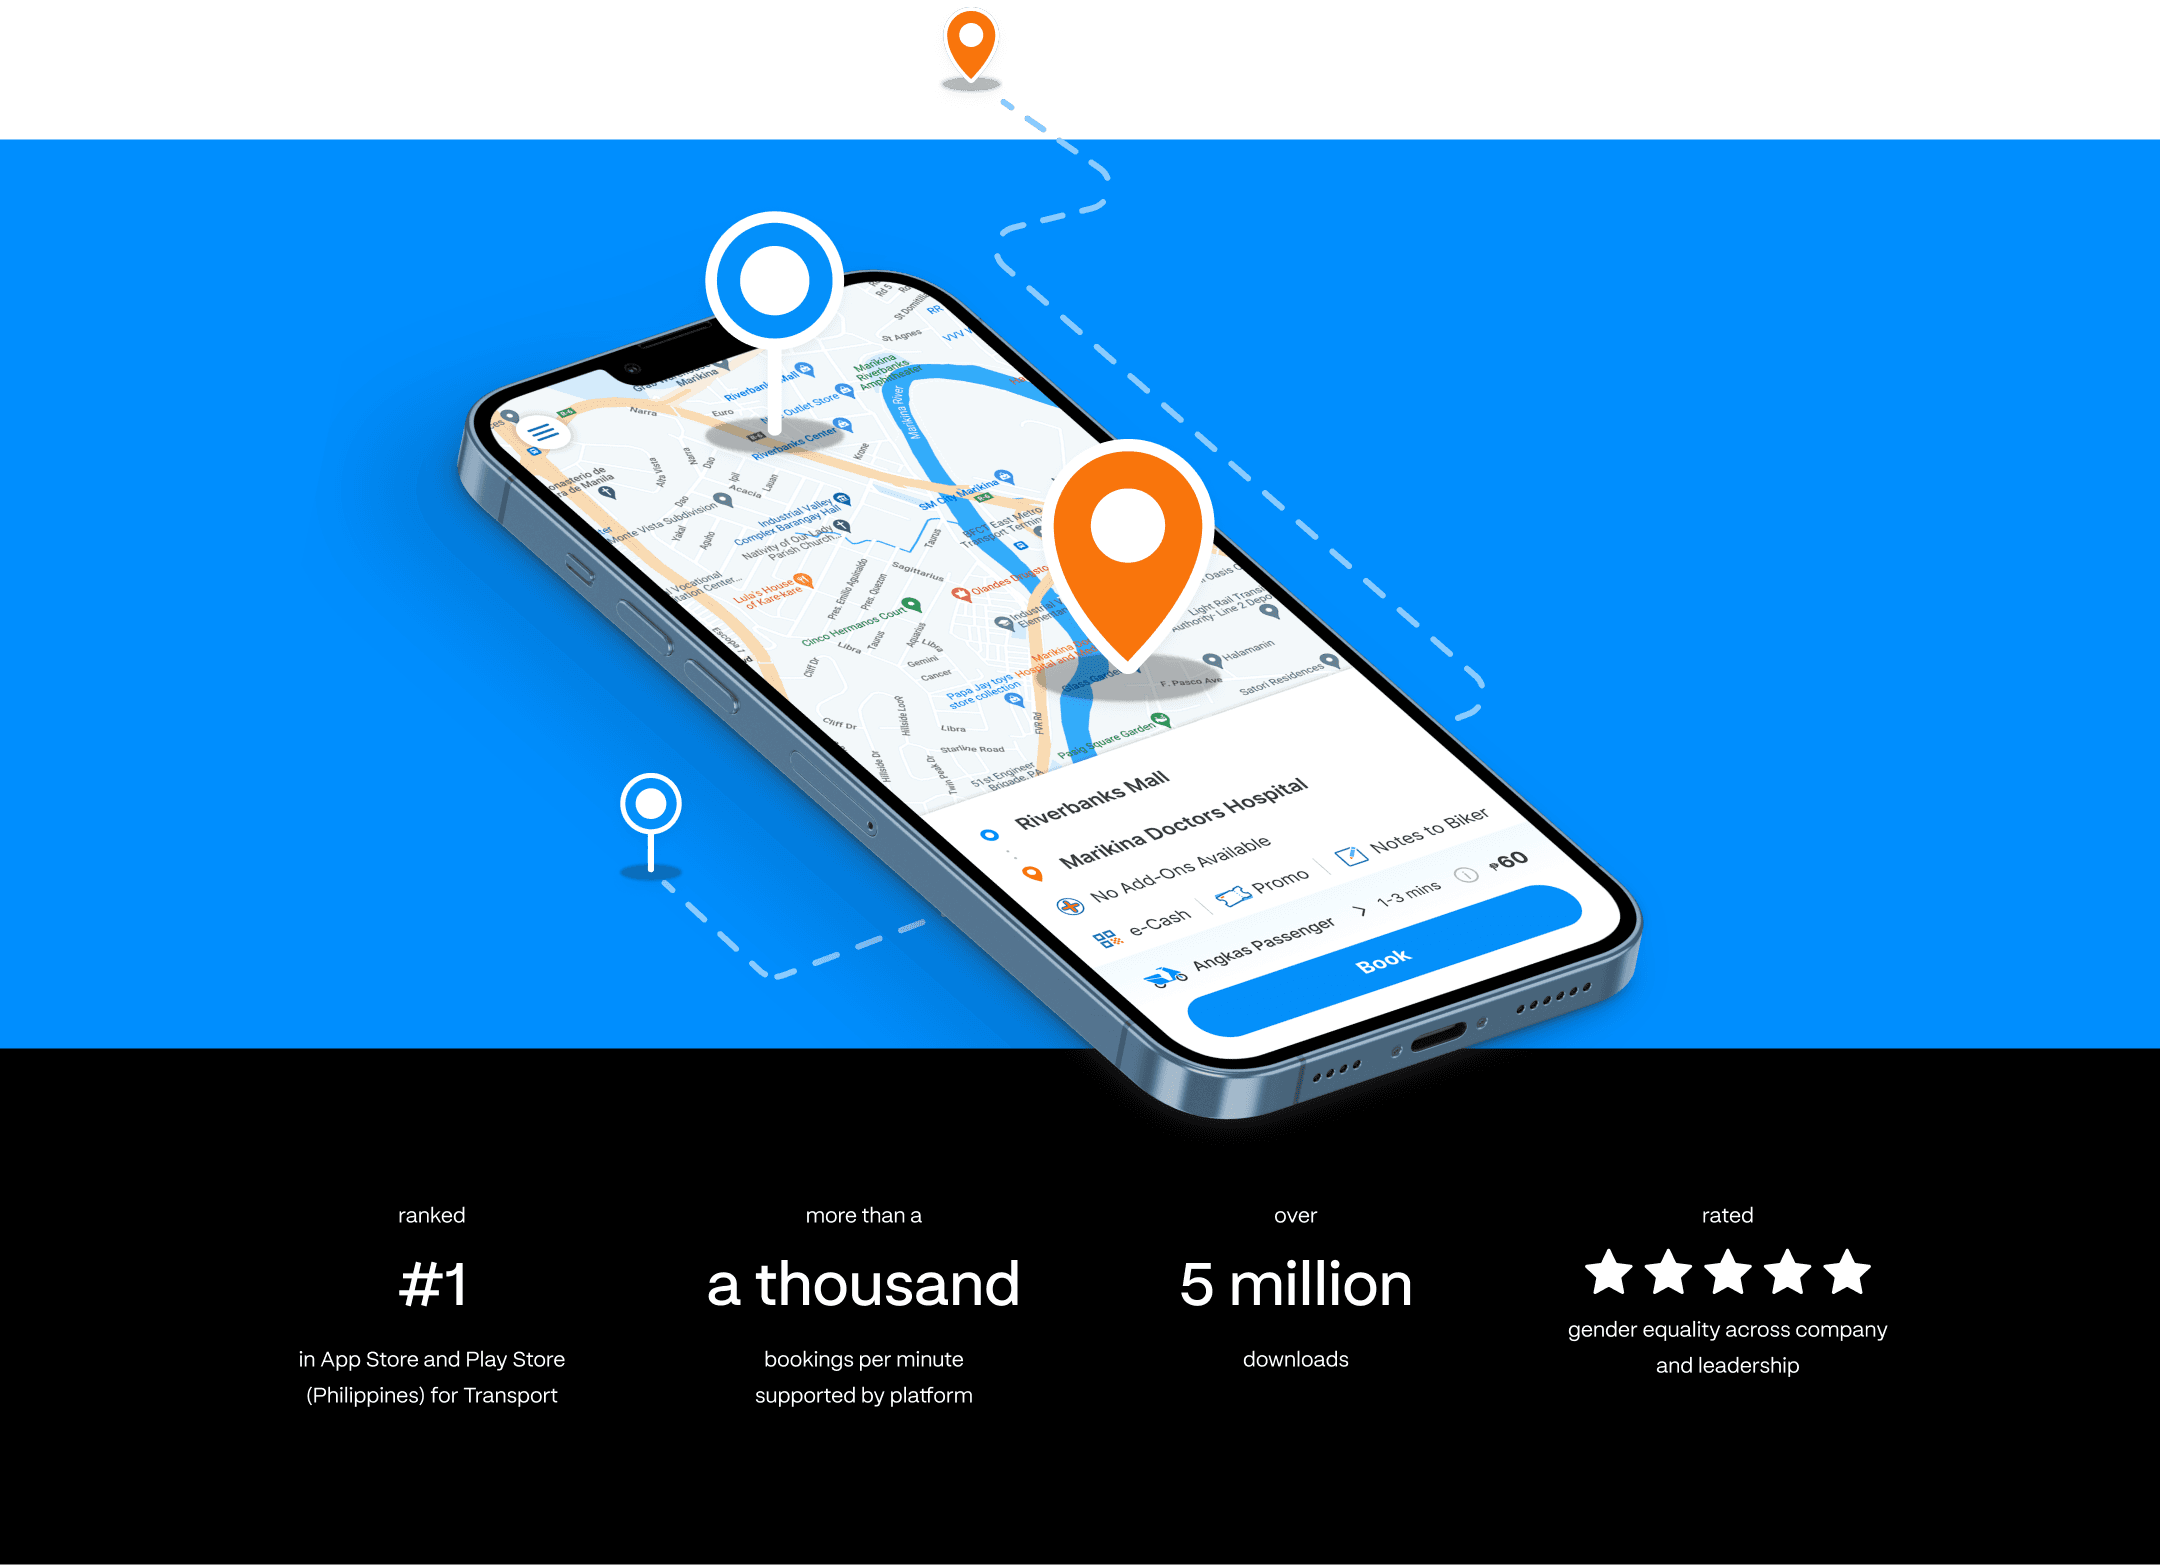
Angkas is the most popular motorcycle taxi platform in the Philippines. We built and designed a massive ride hailing platform, consisting of 7 digital properties on 3 platforms (Web, Android, iOS) in a record 7 months, across 4 cities.

Case Study•
B2B fintech SaaS for one of the country’s biggest conglomerates
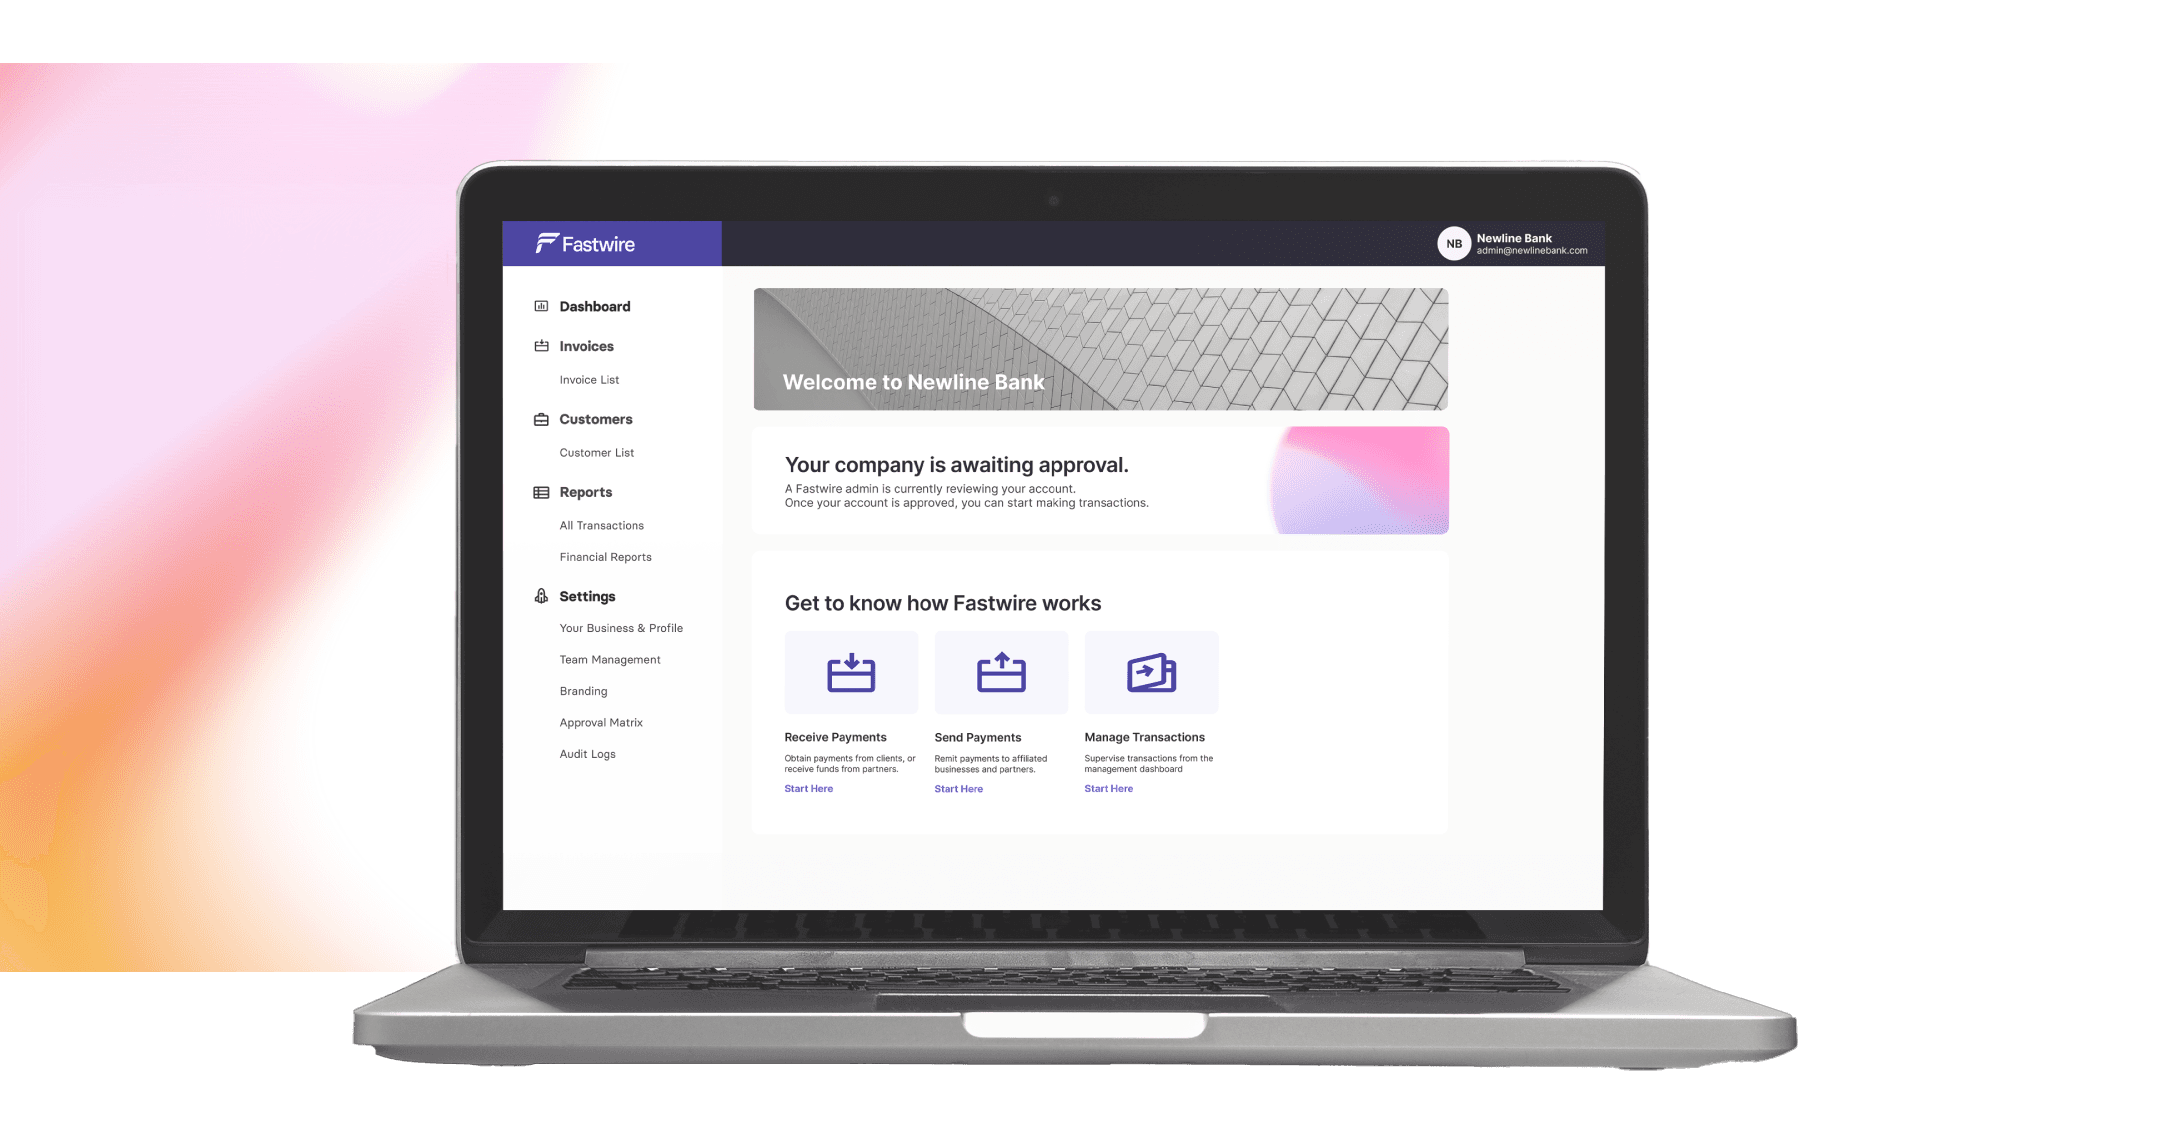
All-in-one B2B financial platform for modern enterprises. Invoicing, payments, reconciliation, reporting, and account management created for Filinvest, one of the largest conglomerates in the Philippines