Article
Unseen, Unfair, Unbeatable—8 Industries Using Knowledge Graphs to Rewrite the Rules of Competition
Last Updated on October 7, 2025
by White Widget Team
White Widget Team
Make your data make sense.
What issues do growing organizations experience as their data scales?
As an organization matures, its collected knowledge scales beyond the threshold of what can easily be navigated by individuals. New datasets need to be aligned with old, friction arises, and the organization increasingly needs to reevaluate the way its data is aggregated and accessed.If this sounds familiar, you're not alone—many teams hit the following roadblocks as their data grows:
- Data quality issues combining disparate sources with conflicting values
- Duplicate or overlapping data points due to fragmented entity identification across systems
- Massive data volume that makes it tedious to find what matters
- A rich domain with so many entity relationships that the database is a maze of tables and columns
How can organizations aggregate diverse enterprise data?
Top companies are using Knowledge Graphs as their edge to unify diverse data in a way that is consistent across sources and aware of the context beyond any single slice.
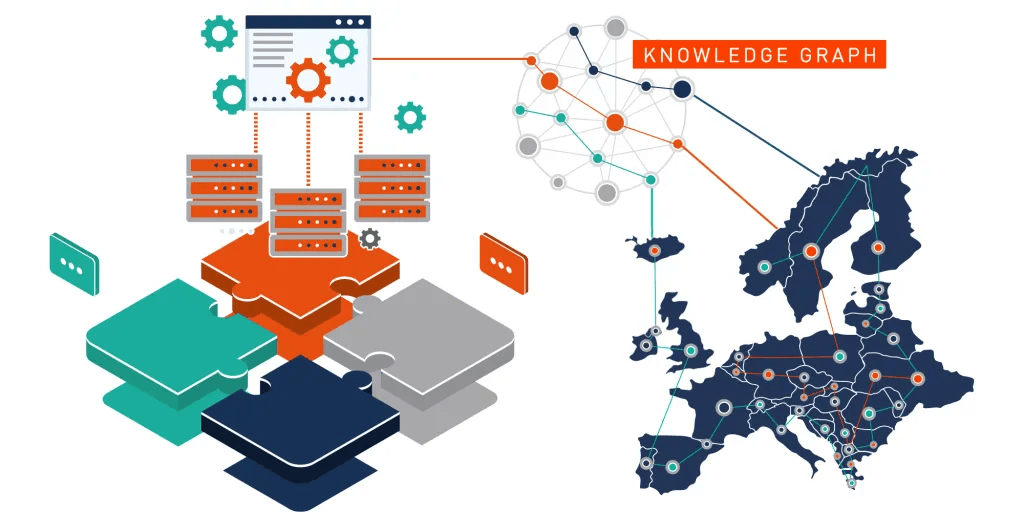
What is a Knowledge Graph? What is it for, and how does it help with scale?
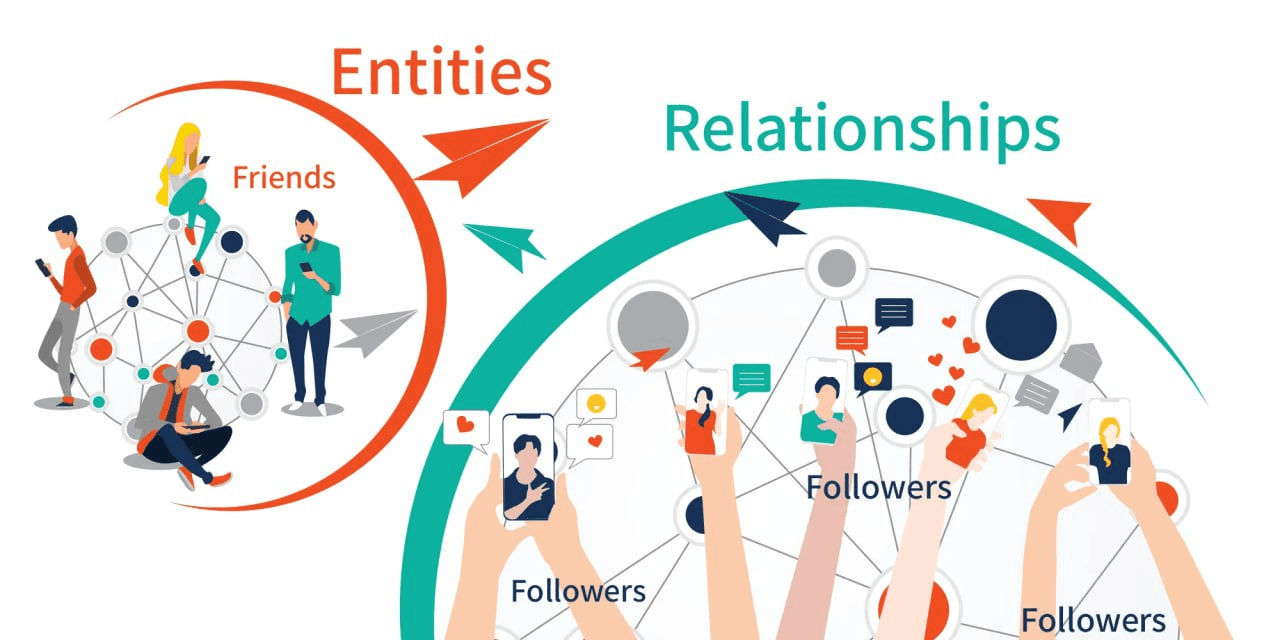
A Knowledge Graph is a way of modeling and storing data as entities, with properties and relationships with other entities, which allows for flexible yet intuitive representation of your data, as well as structured querying and interpretation.
Knowledge Graphs uniquely empower the aggregation of data so that every fact exists only once but is accessible a dozen different ways, reflecting different data sources and stakeholders. This can be used with techniques like Retrieval Augmented Generation (RAG).How Knowledge Graphs solve common data integration and extraction challenges:
- Contradictory Silos: When one system marks a shipment as 1.3 tons, while the next system measures it 1.26 tons, a graph can handle both measurements, tagging provenance so that it’s possible to trace which fact wins, and why.
- Duplication, Entity Alignment, and Entity Enrichment: In the real world, we understand that “Jon Smith” also goes by “Jonathan S.” and “Smith, Jonathan B.” depending on the document we’re sourcing from. Knowledge graphs allow us to reconcile multiple entities, accumulating knowledge within a unified entity rather than creating duplicate rows and running KYC all over again. Furthermore, once we have identity data about an entity, we can enrich what we know by running all known identifiers through other datasets and searching for matches.
- End-to-End Unified Tracking: Standard ontologies provide a unified vocabulary for representing the journey of the same entity across different systems. This means we have a clear way to query supply, from harvesting tomatoes from a farm, tracking the shipping crate they’re packed into, and tracking the logistic units across aggregation and disaggregation events all the way to last mile delivery. We have a single place where we can query, “Where is my item?”
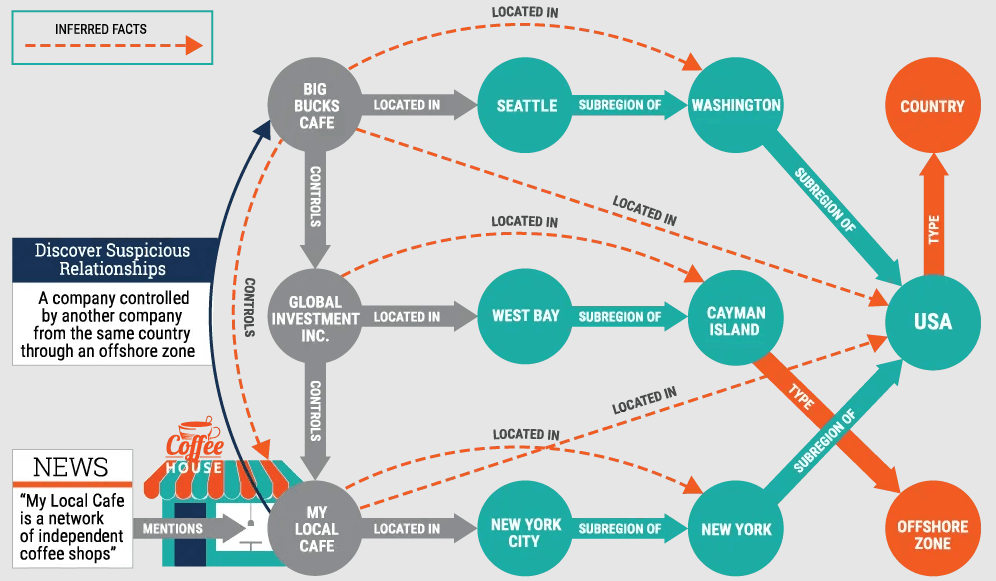
How are Knowledge Graphs used for Finance, AML, and KYC efficiency?
Know-Your-Customer (KYC) is fundamental to financial fields. Entity resolution and enrichment allows specialists to distinguish and merge data about the same entity from various streams. Transaction modeling with a KG traces activity across relationships and entities, painting the bigger picture for investigators to understand.
- JPMorgan Chase built an in-house knowledge graph that stitches together risk, reference, and pricing data across millions of contracts to speed up AML investigations and other compliance analytics. Their solution is built on the Graphwise platform, and White Widget is proud to be a Graphwise partner on solutions like this.
- HSBC co-developed a knowledge-graph-based “Dynamic Risk Assessment” with Google Cloud that now monitors 80 % of its customers for suspicious transactions in seven markets.
Source: Graphwise
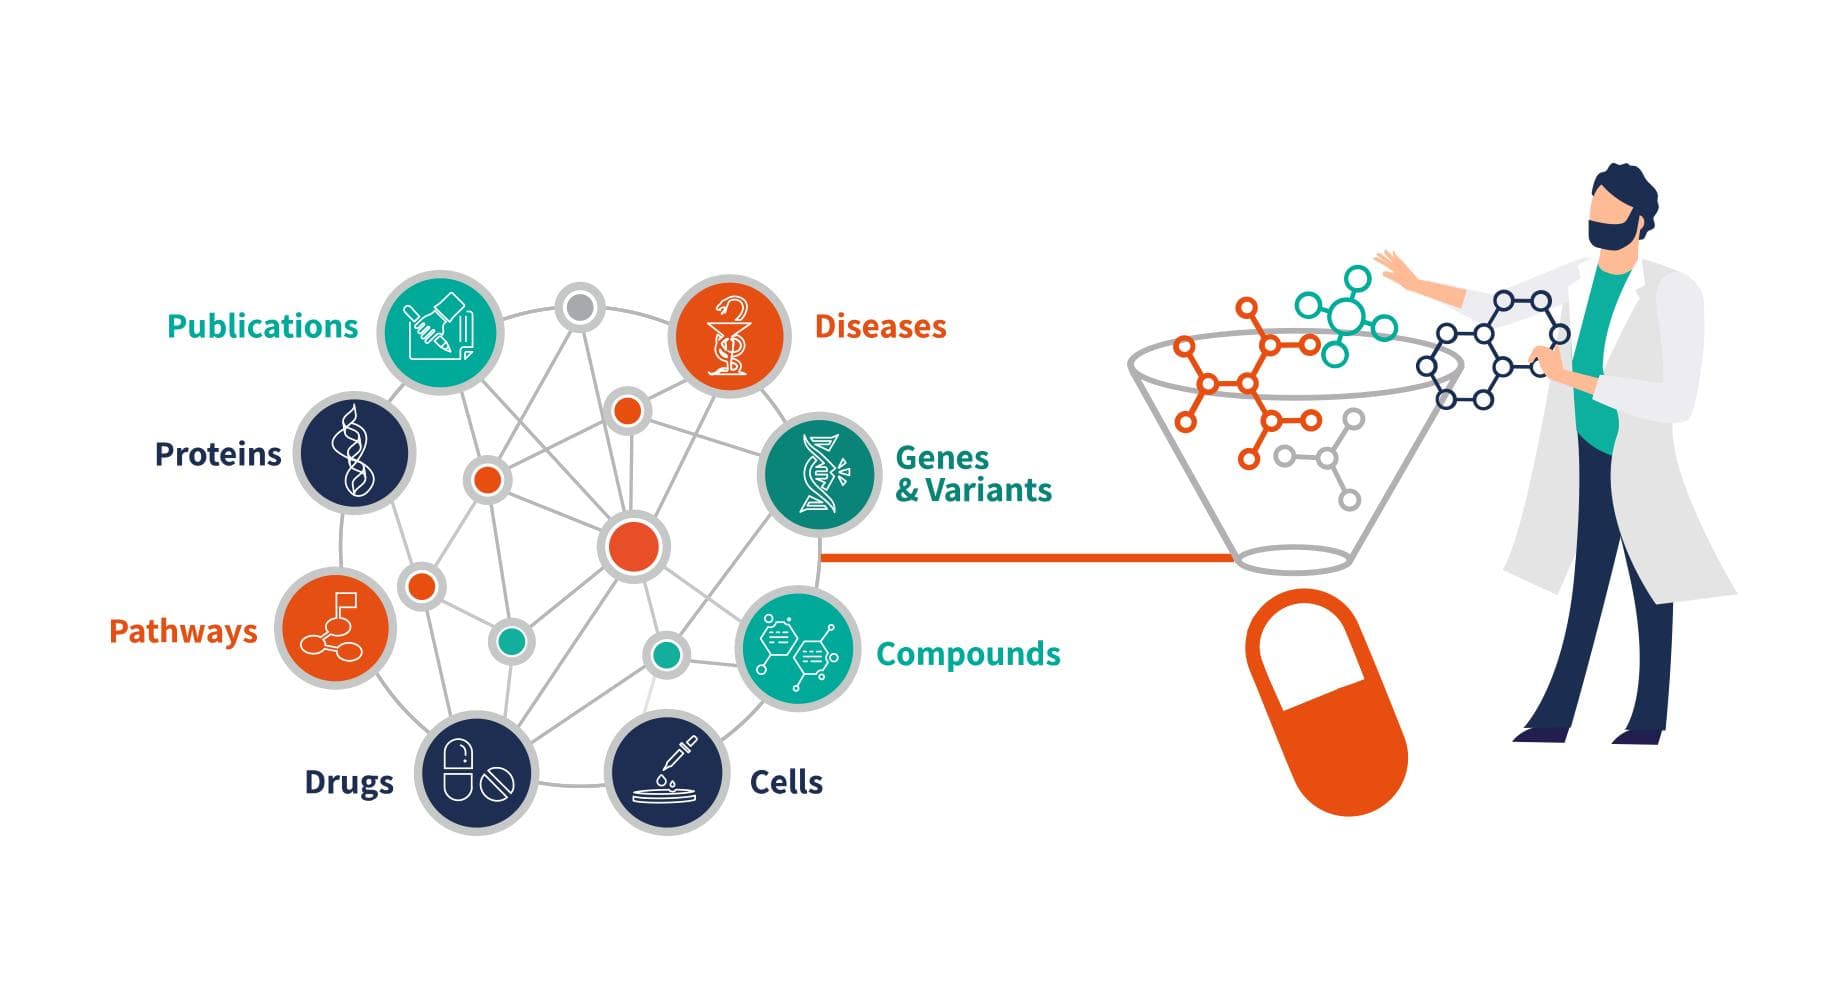
How can Knowledge Graphs and AI accelerate biomedical discovery and drug repurposing?
Healthcare and medicine are among the most data-dense fields, where the challenge isn’t just data volume, but the need to find the right data combinations that unlock breakthroughs.
- Knowledge Graphs have been used to track relationships between genes, proteins, diseases, and research literature—and increasingly, they’re paired with Retrieval-Augmented Generation (RAG) AI to help researchers surface relevant insights faster, as demonstrated by the Oxford Drug Discovery Institute for Alzheimer’s drug discovery.
- BenevolentAI’s biomedical knowledge graph—built from over a billion relationships linking genes, proteins, diseases and drugs—pinpointed the arthritis medicine baricitinib as a COVID-19 therapy, leading partner Eli Lilly to secure FDA emergency-use authorization in November 2020 and proving how graph analytics can slash drug-repurposing timelines.
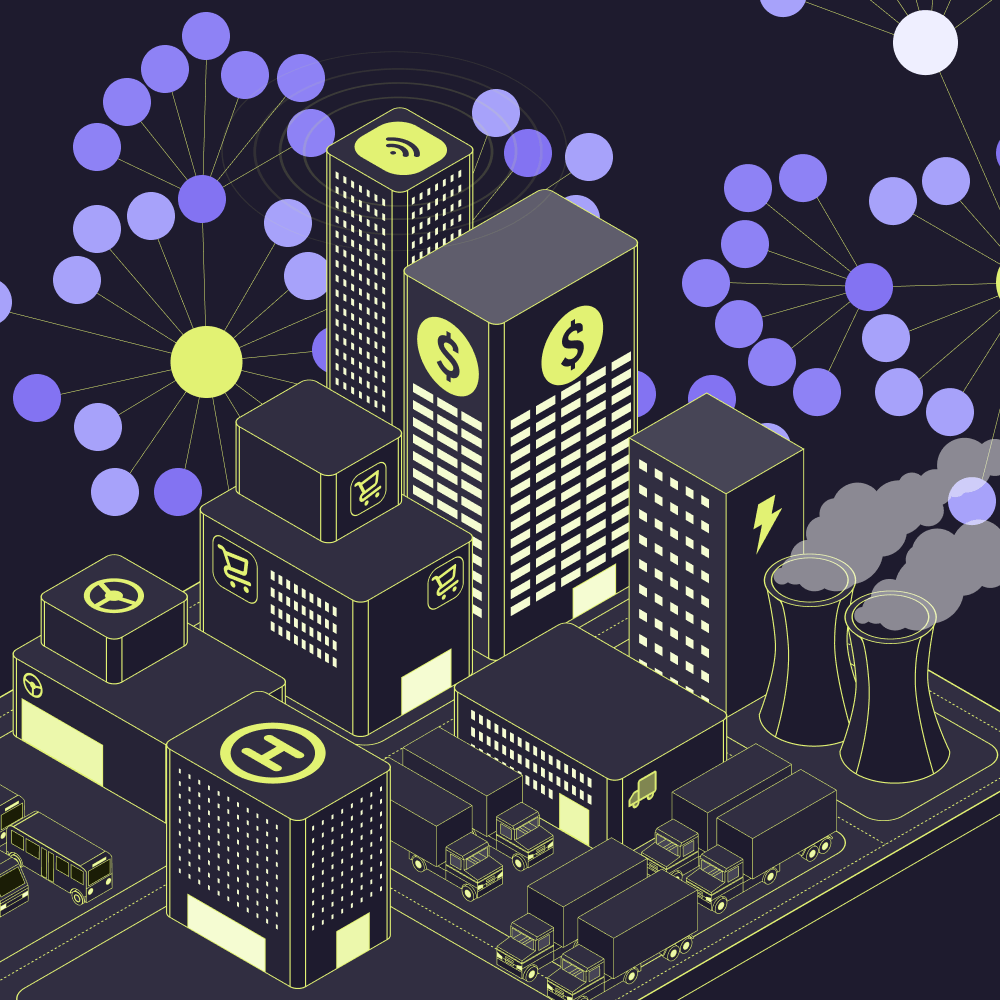
How can Knowledge Graphs bring order to complex telecom networks?
Telecom and networking infrastructure is increasingly complex: networks now span diverse hardware, software, and geographic layers, all generating massive, rapidly-changing data. Knowledge Graphs provide a unified real-time view across these layers, empowering operators to optimize resource allocation, streamline planning, and forecast network demands.
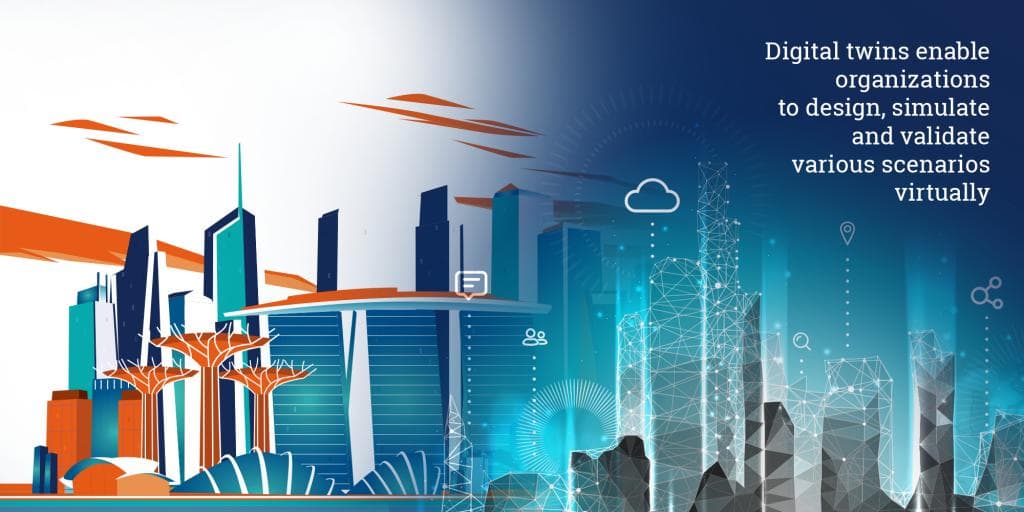
- Nokia leverages unified network inventory, data integration, and digital twin simulation to enable forecasting, simulation, and planning.
- BT Group replaced outdated inventory systems with SRIMS, a Neo4j-based knowledge graph, providing planners instant visibility into network capacity demands across the UK.
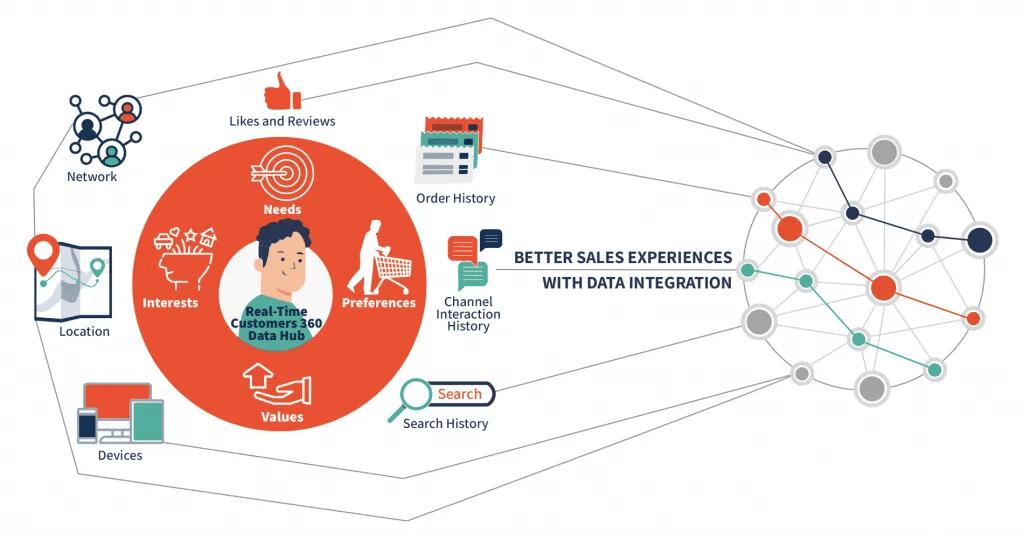
How can retailers use Knowledge Graphs to deliver relevant search and recommendations?
Modern retail and e-commerce host a kaleidoscope of products, each with diverse attributes and categorizations that can confuse search engines, buyers, and even suppliers themselves. Is a GoPro categorized under Gadgets or Sports? KGs mean you don’t have to choose.
- Amazon uses LLMs and KGs for smart recommendations that can discern commonsense relationships for semantic relevance, filling in context like associating a query “winter coat” with “coat for high-level warmth”.
- Alibaba’s AliCoCo graph models user intent as first-class nodes, driving more accurate search and recommendations across its marketplaces.
How do Knowledge Graphs make global supply chains transparent and resilient?
Supply chains today extend across continents, encompassing thousands of products, suppliers, logistics nodes, and regulatory frameworks. With such intricate interdependencies, traditional tools often fail to deliver timely and accurate insights. Knowledge Graphs have emerged as a critical technology for untangling these complexities by simplifying procurement, improving real-time tracking, and enabling predictive analytics to keep supply chains agile, transparent, and resilient.
- The GS1 Web Vocabulary provides a standard ontology for products, their properties, related resources (e.g. instruction manuals), simplifying procurement and linking suppliers with products meeting certain requirements. EPCIS 2.0 then tracks the journey across logistics events, supporting IoT sensors for fine-grained tracking and enabling real-time ETA.
- Scoutbee leverages Neo4j for finding interdependencies across the supply chain, for companies like Unilever, Siemens, and Audi.
- Walmart uses an agri-knowledge graph—500 crops and 10,000 varieties—to forecast harvests and cut spoilage in its fresh-produce supply chain.
How can Knowledge Graphs turn fragmented cybersecurity threat data into actionable defense?
Cybersecurity experts face a deluge of fragmented and heterogeneous data. Cybersecurity Knowledge Graphs (CSKG) are growing in popularity and utility, aggregating existing knowledge from open datasets published to track malware as they’re discovered, matching them with sensor readings, events, and assets.Amazon’s security team populates a massive threat-intelligence knowledge graph (fed by its MadPot honeypot network) that tracks roughly 750 million cyber threats every day—up from 100 million just months earlier. It outputs to a WAF, the AWS Advanced Shield, which we use for some of our customers.
How do Knowledge Graphs power smarter grids and decarbonization efforts?
KGs can collect data from different sources based on data published to the EU’s ENTSO-E Transparency Platform, allowing analysts to surface consistency/quality issues across the network. The intuitive data model makes it easy to follow relations and retrieve data.On a much bigger scale, world-state digital twins can be implemented as a KG in order to model carbon metrics across power generation and distribution, to support decarbonization.
How can Knowledge Graphs unlock smarter mobility and city planning?
Geodata and mobility are naturally graph-oriented. Points of interest are spatially and semantically related to each other, with hierarchical attributes derived from those relationships. For example, results for the query for “cafes in Sacramento” should also be visible from “coffee in California”. Experts are exploring Knowledge Graphs for tracking station-to-station flow andpredicting trip destinations, using techniques like Graph Deep Learning to predict general travel patterns within the complex urban environment.
- At White Widget, we’ve successfully used Graphwise GraphDB for modeling the political, geographic, and demographic data of an entire country across years of changing data, letting inference do the heavy lifting in surfacing City-Province-Region relationships (among many other things). This includes accounting for special cases, like a city being geographically part of one province but politically within a separate region, as in the case of Isabela City in Basilan Province and Zamboanga Peninsula.
- The University of Cambridge’s “World Avatar” dynamic knowledge graph fuses flood models, OpenStreetMap layers and 3-D building data, letting planners test resilience scenarios for coastal towns in real time.
Let’s Link Your Data
Knowledge Graphs have the transformative potential to unify your data silos, resolve ambiguity, and empower your teams to rapidly uncover actionable insights.Ready to simplify your complex data landscape? Let's talk about how a Knowledge Graph can help your organization unlock hidden insights and make smarter decisions. Reach out to White Widget today—we'd love to hear about your data challenges and explore tailored solutions together.
About the Authors
White Widget Team is known for delivering holistic, award-winning software solutions across diverse sectors such as transport, healthcare, and media, emphasizing a comprehensive approach to digital innovation, since the company was founded in 2012.